MeetjeStad

MeetjeStad graphs

MeetjeStad radio details

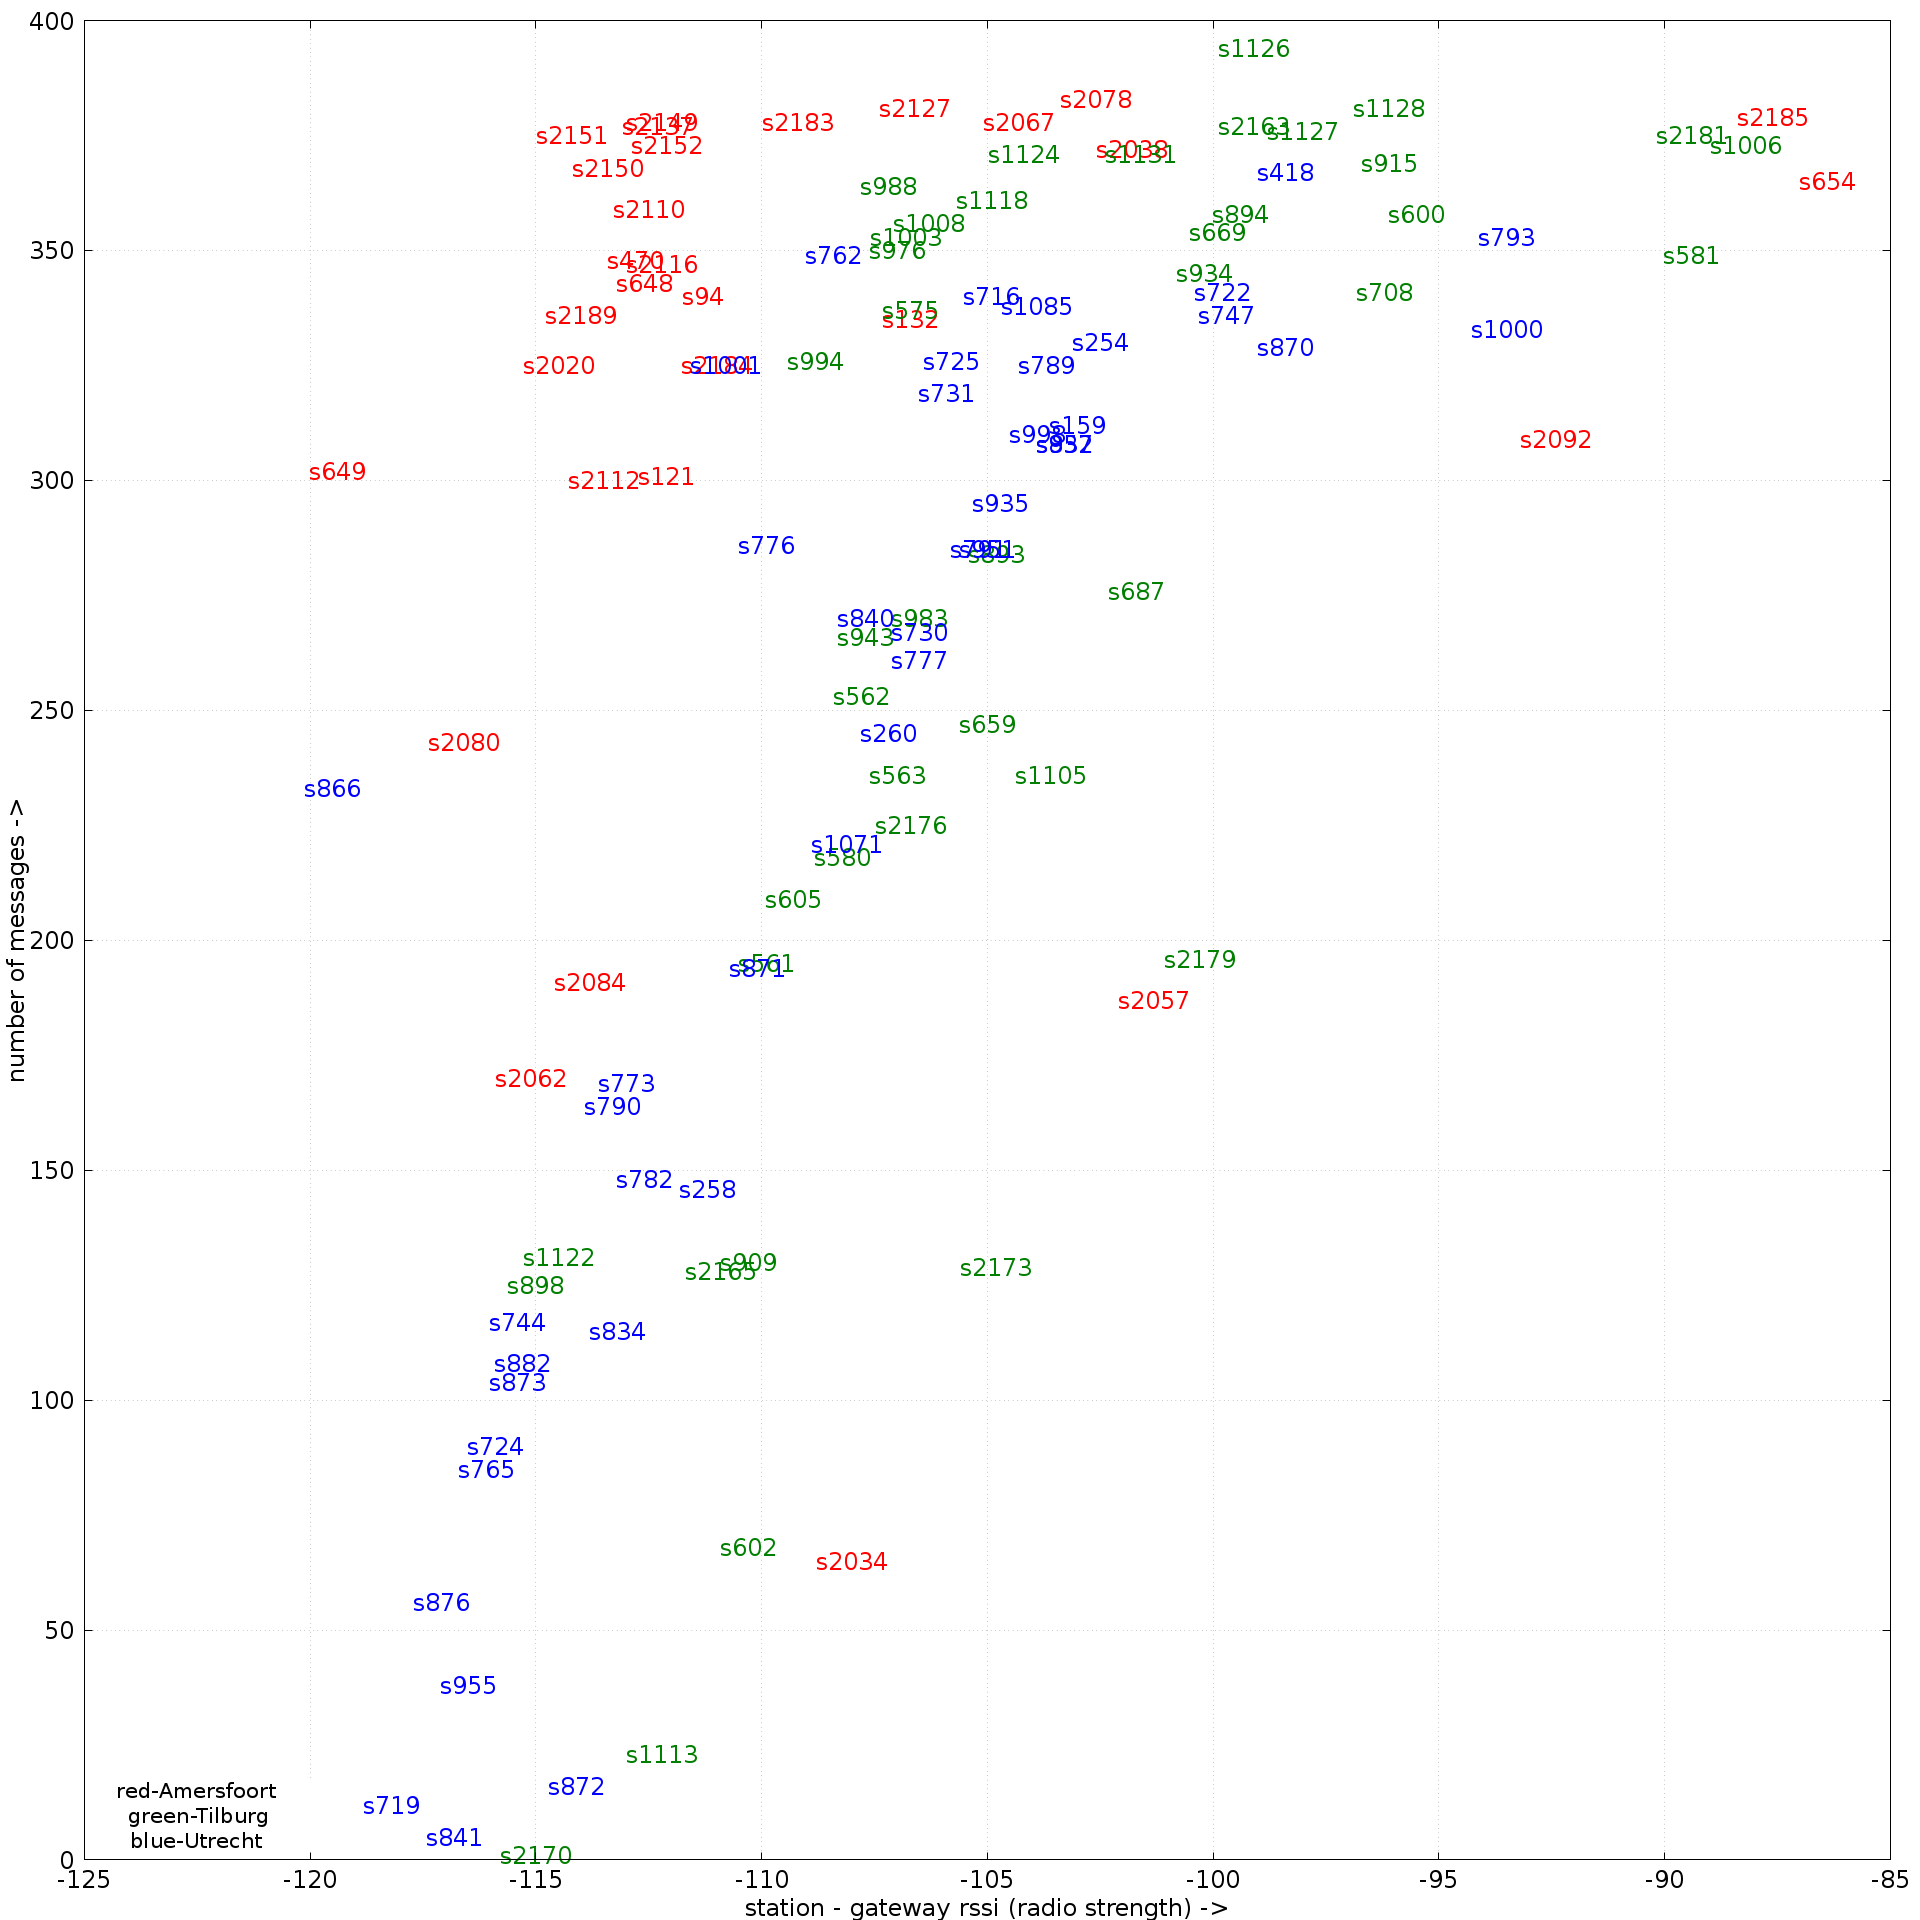
Frequency of messages (success) by radio signal strength

From the data gathered, a scatter plot of the number of received messages (vertical) as a function of the highest rssi (strength, horizontal) was created.
On average, each station sends 1 measurement every 15.5 minutes, or 93 per day.
The numbers in the graph are station IDs.

Abbreviations used in the raw Data:
  st_id   station ID
  mcount   number of measurements received in this period
  gwdist   distance to the best(*) gateway in km
  rssi   rssi with the best(*) gateway in dB
  snr   snr with the best(*) gateway in dB

Data:   Amersfoort   Tilburg   Utrecht     Plot


(*) best gateway = gateway with the highest rssi

top